An A/B test settles arguments about your website with data instead of opinions. You show half your visitors version A and the other half version B, then count which one sells more. By the end, you’ll know what to test and how long to run it. You’ll also know how to read the result and set it up on Shopify, WordPress or any other site. The tools can be free. The only thing it really costs is patience.
And patience is the hard part. Websites are like sourdough: you can’t rush them by staring at them.
What A/B testing is, and why guessing loses
Here’s the idea in one picture. Your visitors get split at random into two groups. One group sees your current page, called the control. The other sees your new idea. Everything else stays the same, so any difference in sales comes from the change.
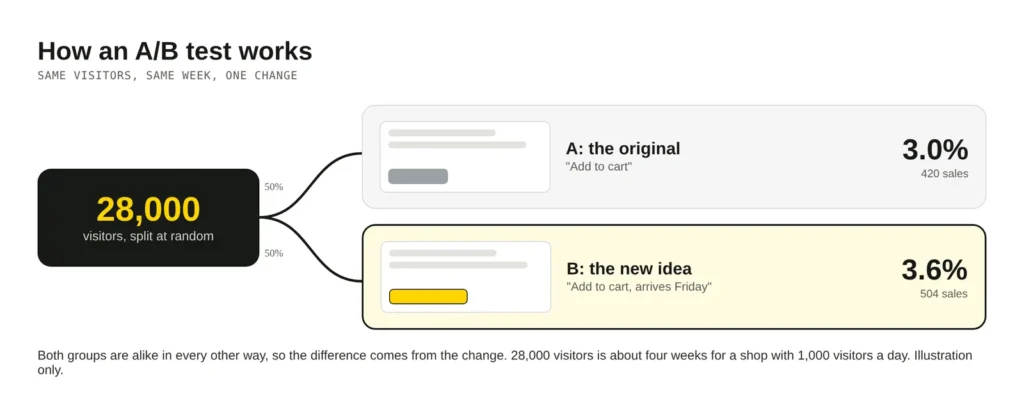
Why bother, when you could just ask your team which design looks better? Because people are terrible at guessing what visitors will do. Experts included. Look at a few real tests:
| Who | What they changed | What happened |
|---|---|---|
| Obama campaign, 2008 | Signup page button and photo | Sign-ups rose 40.6%, an estimated US$60 million in extra donations |
| Bing, 2012 | How ad headlines were shown | Revenue up 12%, over US$100 million a year in the US alone |
| Bing, 2013 | Slightly different shades of blue and green in links | More than US$10 million extra a year |
| Bing | A social media panel that cost over US$25 million to build | Almost no change at all |
The detail I love most is from the Obama test. The staff loved one of the videos and were sure it would win. In the end, all of the videos did worse than all of the photos. And the Bing idea that earned US$100 million a year sat in a to-do list for over six months, because nobody thought it mattered.
Now the humbling part. At Google and Bing, only about 10 to 20% of tests win. That figure comes from Ronny Kohavi and Stefan Thomke in the Harvard Business Review. These are some of the best-run websites on Earth. If their ideas mostly fail, our hunches deserve a test too.
Who it helps, and what to test first
Anyone with a goal and enough visitors can use it. Shops test product pages and checkout. Service businesses test their enquiry forms. Software companies test signup pages and pricing tables. Even a blog can test which headline gets more readers to join the newsletter, and finally settle the argument about exclamation marks.
I’d start where money changes hands, then work outwards. Good first tests:
- The main button: its wording, colour or position. For Obama, a plain “Learn More” beat three other labels, so don’t assume.
- The hero image or headline on your best-selling product page.
- Shipping messages, like showing the free-shipping amount near the cart button.
- Fewer form fields on your contact or checkout form.
- Page speed. Bing found every tenth of a second of delay cost it 0.6% of revenue, so a faster site is worth testing too.
Write each idea as a simple guess you can prove wrong, with a reason. For example: “Showing the delivery date will get more people to add to cart, because they’ll know it arrives before the weekend.” The reason is what you learn from, even when the test loses. Not sure where to start? Heatmaps and session recordings show you where people get stuck, which is a great source of ideas.
How long a test needs
This is where most tests go wrong. The answer depends on three numbers: how many visitors you get, how often they buy now, and how big a change you hope to see. Small changes need lots of visitors to spot. Big changes show up faster. Play with the calculator to see it for your own site:
<div class="calc">
  <div class="field">
    <label for="vis">Visitors per day</label>
    <output id="visOut" for="vis">1,000</output>
    <input type="range" id="vis" min="100" max="20000" step="100" value="1000">
  </div>
  <div class="field">
    <label for="cr">Conversion rate now</label>
    <output id="crOut" for="cr">3.0%</output>
    <input type="range" id="cr" min="0.5" max="10" step="0.1" value="3">
  </div>
  <fieldset class="lift">
    <legend>Improvement you hope to spot</legend>
    <label><input type="radio" name="lift" value="0.05"><span>+5%</span></label>
    <label><input type="radio" name="lift" value="0.10"><span>+10%</span></label>
    <label><input type="radio" name="lift" value="0.20" checked><span>+20%</span></label>
    <label><input type="radio" name="lift" value="0.30"><span>+30%</span></label>
  </fieldset>
  <div class="result" aria-live="polite">
    <p class="big"><span id="days">28</span> days</p>
    <p class="detail" id="detail"></p>
    <p class="verdict" id="verdict"></p>
  </div>
  <div class="chart" aria-hidden="true">
    <p class="chart__title">Days needed for each improvement</p>
    <div class="bars" id="bars"></div>
  </div>
</div>
body{padding:16px}
.calc{width:100%;max-width:560px;font-family:"DM Sans",system-ui,sans-serif;color:#171915;background:#fff;border:1px solid #D7D7D7;border-radius:16px;padding:20px}
.field{display:grid;grid-template-columns:1fr auto;align-items:baseline;gap:4px 10px;margin-bottom:16px}
.field label{font-weight:700;font-size:15px}
.field output{font-family:"Space Mono",ui-monospace,monospace;font-size:15px;font-weight:700}
.field input{grid-column:1/-1;width:100%;accent-color:#171915;height:28px;cursor:pointer}
.lift{border:0;padding:0;margin:0 0 16px;display:flex;flex-wrap:wrap;gap:8px}
.lift legend{font-weight:700;font-size:15px;margin-bottom:8px;padding:0}
.lift label{flex:1 1 60px;cursor:pointer}
.lift input{position:absolute;opacity:0;pointer-events:none}
.lift span{display:block;text-align:center;padding:9px 6px;border:1px solid #D7D7D7;border-radius:10px;font-weight:700;font-size:15px;background:#F4F4F4}
.lift input:checked+span{background:#FFD400;border-color:#171915}
.lift input:focus-visible+span{outline:3px solid #171915;outline-offset:2px}
.result{background:#171915;color:#fff;border-radius:12px;padding:14px 16px;margin-bottom:16px}
.result p{margin:0}
.big{font-family:Manrope,system-ui,sans-serif;font-weight:800;font-size:32px;line-height:1.1}
.big span{color:#FFD400}
.detail{font-size:14px;color:#cfd0ca;margin-top:4px!important}
.verdict{font-size:15px;margin-top:8px!important}
.chart__title{font-size:13px;font-family:"Space Mono",ui-monospace,monospace;color:#5C5E57;margin:0 0 8px}
.bar{display:grid;grid-template-columns:44px 1fr 64px;align-items:center;gap:8px;margin-bottom:6px;font-size:13px}
.bar__track{background:#F4F4F4;border-radius:6px;height:16px;overflow:hidden}
.bar__fill{height:100%;background:#D7D7D7;border-radius:6px;transition:width .3s}
.bar.on .bar__fill{background:#FFD400;box-shadow:inset 0 0 0 1px #171915}
.bar.on{font-weight:700}
.bar__val{font-family:"Space Mono",ui-monospace,monospace;text-align:right}
@media (prefers-reduced-motion:reduce){.bar__fill{transition:none}}(function () {
var Z1 = 1.959964, Z2 = 0.841621, CAP = 180;
var vis = document.getElementById('vis'), cr = document.getElementById('cr');
var fmt = function (n) { return Math.round(n).toLocaleString('en-AU'); };
// Visitors needed per version: two-sided 95% significance, 80% power.
function perVersion(p, lift) {
var p2 = p * (1 + lift), pb = (p + p2) / 2;
var a = Z1 * Math.sqrt(2 * pb * (1 - pb)) + Z2 * Math.sqrt(p * (1 - p) + p2 * (1 - p2));
return Math.ceil(a * a / Math.pow(p2 - p, 2));
}
function update() {
var v = +vis.value, p = +cr.value / 100;
var lift = +document.querySelector('input[name=lift]:checked').value;
document.getElementById('visOut').textContent = fmt(v);
document.getElementById('crOut').textContent = (+cr.value).toFixed(1) + '%';
var n = perVersion(p, lift), days = Math.ceil(n * 2 / v);
document.getElementById('days').textContent = days > 999 ? '999+' : fmt(days);
document.getElementById('detail').textContent = fmt(n) + ' visitors per version, ' + fmt(n * 2) + ' in total';
var msg;
if (days <= 14) msg = 'Quick. Still run it for two full weeks, so every day of the week is covered.';
else if (days <= 42) msg = 'Doable. Plan for about ' + Math.ceil(days / 7) + ' weeks, and don’t stop early.';
else if (days <= 90) msg = 'Slow. Think about testing a bolder change that should make a bigger difference.';
else msg = 'Too slow for a change this small. Test something bigger, or make the change without a test.';
document.getElementById('verdict').textContent = msg;
var html = '';
[0.05, 0.10, 0.20, 0.30].forEach(function (l) {
var d = Math.ceil(perVersion(p, l) * 2 / v), w = Math.max(2, Math.min(d, CAP) / CAP * 100);
html += '<div class="bar' + (l === lift ? ' on' : '') + '"><span>+' + Math.round(l * 100) + '%</span>' +
'<span class="bar__track"><span class="bar__fill" style="display:block;width:' + w + '%"></span></span>' +
'<span class="bar__val">' + (d > CAP ? CAP + '+ d' : d + ' d') + '</span></div>';
});
document.getElementById('bars').innerHTML = html;
}
document.querySelectorAll('input').forEach(function (i) { i.addEventListener('input', update); i.addEventListener('change', update); });
update();
})();Here’s an example I worked out with the calculator. A shop with 1,000 visitors a day that converts 3% of them needs about four weeks to reliably spot a 20% improvement. To spot a 10% improvement, it needs over three months. Many winning changes are smaller than that, which is why small sites struggle to test small changes.
Three rules keep the result honest:
- Decide the length before you start, then don’t stop early. Checking every day and stopping the moment one version looks ahead is called peeking. In one worked example, it pushed the chance of a fake winner from 5% up to 26%. That’s a coin flip with extra steps.
- Run for full weeks, at least one and ideally two. People shop differently on Monday morning and Saturday night, so cover every day of the week.
- Keep everything else still. Don’t launch a big sale or change your ads halfway through. Otherwise you’re testing the sale, not the button.
If the calculator says months, you have three options. Test a bigger, bolder change. Test something higher up the page, where more people see it. Or skip the A/B test and make the change based on your research, then watch your sales. A test you can’t finish is just a very slow coin toss.
How to read the result
When the test reaches its planned length, your tool shows each version’s conversion rate and a confidence figure. Most tools aim for 95%. In plain words, it means “there’s a small chance this difference is just luck”. It does not mean the winner is 95% better.
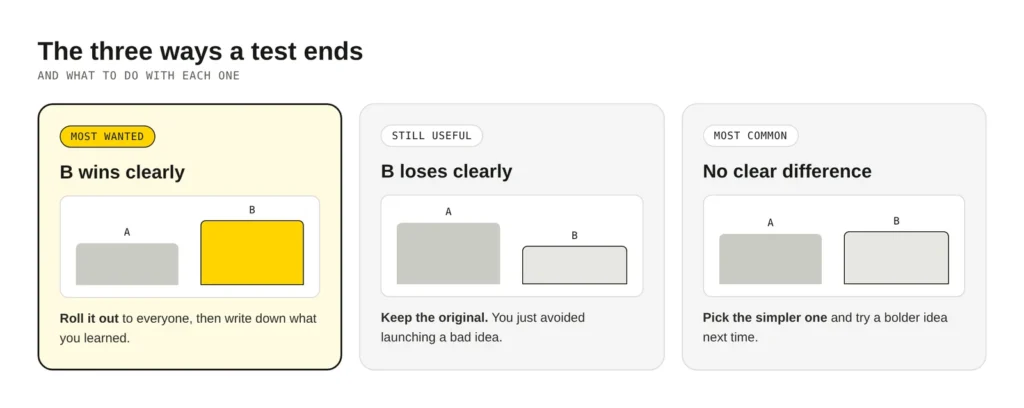
Every test ends in one of three ways:
- B wins clearly. Roll it out to everyone, and write down what you learned.
- B loses clearly. Keep the original, and be glad you didn’t launch it on gut feeling alone. A loss you tested is a disaster you avoided.
- No clear difference. This is the most common result. It means the change didn’t matter much, so pick whichever is cheaper or simpler, and move on to a bolder idea.
A few things trip people up when reading results. Look at sales or revenue per visitor, not just clicks, because more clicks on a button that leads nowhere is not a win. Be careful slicing results by device or country after the fact. Slice the data enough ways and something will always look like a winner by chance. And check the split itself: if your tool planned 50/50 but shows 60/40, something is broken, and the result can’t be trusted.
How to set it up on your site
Google Optimize used to be the free default, but Google shut it down on 30 September 2023. If a guide still tells you to use it, the guide is older than it looks. Here’s what to use now.
On Shopify
Shopify added its own testing tool, Rollouts, in mid-2026. You’ll find it in your admin under Markets → Rollouts. It can split visitors between two versions of your theme and report the results with Shopify’s own analytics. Which plans get the full experiment mode varies, so check yours in the admin. Rollouts can’t test prices, shipping rates or offers yet. For those, apps like Intelligems are the usual choice.
On WordPress
A plugin is the easiest path. Nelio A/B Testing lets you build a second version of a page, headline or WooCommerce product inside WordPress, and splits your visitors for you. It has a free version and paid plans. Bigger stores often use a dedicated testing service instead, which works on any site.
On any site, with code
Testing services like PostHog and GrowthBook have generous free tiers and work with any platform. You add their script, then ask it which version each visitor should see. Under the hood, the idea is this simple:
// Give each visitor a version once, and remember it,
// so they don't see the page flip back and forth.
let version = localStorage.getItem('hero-test');
if (!version) {
  version = Math.random() < 0.5 ? 'A' : 'B';
  localStorage.setItem('hero-test', version);
}

if (version === 'B') {
  document.querySelector('.hero h1').textContent = 'Arrives before the weekend';
}

// Tell your analytics which version they saw,
// so you can compare sales between the two groups.
analytics.track('hero_test_seen', { version });
That’s fine for learning, but I’d use a proper tool for real tests. It handles the maths, stops the page flickering while it switches versions, and keeps search engines happy. One more thing: testing tools store data in the browser, so they belong in your cookie consent setup like any other tracking.
Use the result, then test again
A finished test is only useful if you act on it. Roll out the winner, then keep a simple log: what you changed, what you expected, what happened and what you learned. After a few months, that log is worth more than any single test, because it shows what your customers respond to. It also stops someone running the same losing test again next year, which happens more often than anyone admits.
Once a winner is live, keep an eye on these for a few weeks:
- Conversion rate and revenue per visitor, to check the lift holds up outside the test.
- Average order value, in case more people buy but spend less.
- Refunds and support emails, in case the change confused anyone.
Then pick the next idea and run it. The companies that win at this aren’t the ones with the best ideas. They’re the ones that test the most ideas, and accept that most will lose. If you’d like help setting up your first tests and reading the results, our site updates service covers it.
Opens in a new tab


Comments
No comments yet. Questions, fixes and better ways are all welcome.